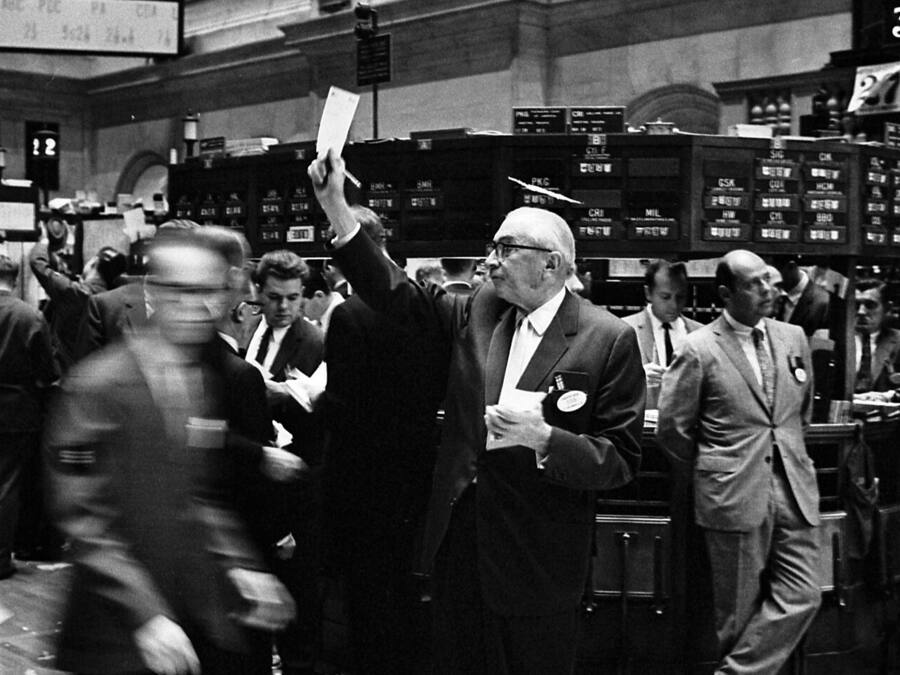

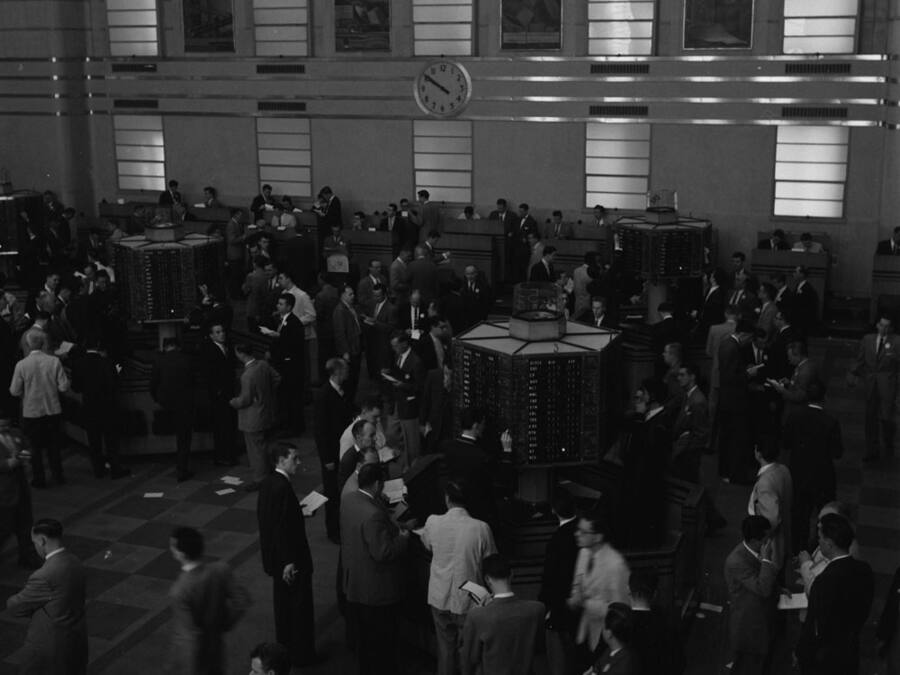
Photographs, public domain via Wikimedia Commons: “NY stock exchange traders floor” by Thomas J. O’Halloran; “Thomas Edison stock ticker” by Jaclyn Nash; “Toronto Stock Exchange” by Chris Lund.
2 names on the sheet
0 from the weekly screen, 2 from the daily
1 confirmed on both timeframes
2 names passed the screens on the close of 26 October 2026. One is published in full here; the rest are held for subscribers.
Subscribe for the full sheetEvery name on this sheet is read against the same benchmark. It closed at 7623.68 on 23 October, down 1.5% over the last 20 sessions.

S&P 500, daily closes to 23 October. The shaded band is the 20 sessions every change figure on this page is measured over.
323.04
gained 15.4% over 20 sessions

Weekly and daily
Earnings 25 Nov 2026.
A tight coil is forming on the daily timeframe. Volatility is contracting after the prior advance. The volume profile favors accumulation. Large buyers are quietly building positions. It has gained 15.4% over the last 20 trading days and trades at 323.04.
price and trace in the subscriber edition
Daily
This name is rated B. The ticker, the price at publication and its price trace are in the subscriber edition.
1 more name cleared the screens today. Subscribers get every name, its price at publication and its trace, plus the whole list as one TradingView watchlist string.
Subscribe for the full sheet